Posts

Image
Employment Outlook to 2026 Workforce conditions in Maine are very tight in 2018, with unemployment and other measures of labor market slack at historically low levels. This is a positive development for individuals, but a challenge for employers who are concerned about future labor availability. This blog provides context to how this situation developed, then looks at our forecast for employment through 2026. How We Reached This Point From the early 1960s until 2007, employment in Maine nearly doubled. The rate of growth slowed in the 1990s, and, except for the decline and recovery during and after the 2008 and 2009 recession, employment has been relatively unchanged over the last decade. This recent lack of growth is because the prime working-age population of the state has contracted modestly. Combined with strong economic conditions, this has created a very competitive hiring and retention environment that has driven inflation-adjusted average wages up at the fastest...
Image
Dispelling Two Myths About the Unemployment Rate The unemployment rate is the most widely followed and cited economic statistic in the United States. Rates are provided each month for the nation, states, counties, many cities and towns, and other areas. They are produced using a consistent methodology to be comparable from one area to another, and from one period to another. Unemployment rates provide an easy to interpret indication of workforce conditions: low rates or a downward trend is positive; high rates or an upward trend is negative. Though seemingly straightforward, there are many widely held misconceptions or myths about how information on unemployed people is compiled, and who is or is not included. With that in mind, let’s dissect two myths about unemployment statistics. Myth: All jobless people are unemployed In 2017, close to 62 percent of the age 16 and over population in Maine were employed, so 38 percent were not employed. Nationally, about 60 percent were...

2017 Workforce Data Revisions: Stronger Growth and Less Monthly Variability than Previously Indicated

Image
Annual revisions to labor force and nonfarm payroll jobs estimates have been published. Those revisions, based on more complete data, indicate the unemployment rate was little changed throughout 2017 and nonfarm payroll job growth was slightly stronger than previously thought. Monthly data cited in this brief is seasonally adjusted. Unemployment Rate Preliminary estimates, released on a monthly basis throughout the year, indicated that unemployment reached lows of 3.0 percent in the spring and at the end of the year, and highs of 3.7 and 3.8 percent in the summer. Revised rates indicate unemployment was not quite as low or high – 3.3 percent in the spring and 3.5 percent in the summer, ending the year at 3.1 percent in December. Given margins of error in the survey sample, there was essentially no change in the unemployment rate last year. Revised estimates now indicate that unemployment was below 4 percent for 25 consecutive months through December 2017. This is the lon...

2016 Workforce Data Revisions: Stronger Growth Than Previously Thought

Image
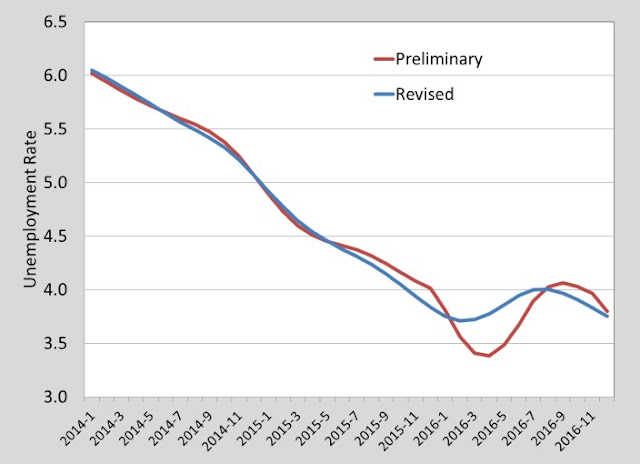
Annual revisions to labor force and nonfarm payroll jobs estimates have been published. Those revisions, based on more complete data, indicate the unemployment rate was little changed throughout 2016 and nonfarm payroll job growth was stronger than previously thought. Data cited in this brief is seasonally adjusted.   Unemployment Rate   Estimates released on a monthly basis throughout the year indicated that unemployment reached lows of 3.4 percent in the spring and highs of 4.1 percent in the fall. Revisions based on more complete data indicate unemployment was not quite as low in the spring (3.7 percent) or as high in the fall (4.0 percent), ending the year at 3.8 percent in December. Given margins of error in the survey sample, there was essentially no change in the unemployment rate last year.   Unemployment rates were below 4 percent in 12 of the last 15 months, which is historically unusual. In the last 40 years, unemployment was below 4 percent in two ...

Job Flows in the Recession and Recovery

Image
The monthly release of unemployment rate and nonfarm payroll jobs estimates is among the most widely followed set of economic indicators in the United States. News accounts often portray net payroll job growth as “hiring” or net job loss as “layoffs.” Neither characterization is correct. In any given month the number of people who were hired or who separated from a job is much larger than the net job change. Patterns of Hires and Separations During and shortly after the 2008 to 2009 recession, the number of nonfarm jobs in Maine declined by nearly 25,000 to an average of 593,000 in 2010. Though many individuals lost their jobs, the large net job losses occurred despite the fact that the number of job separations declined by more than 9,000 per quarter. Net job losses were primarily due to an even larger decline in hires than separations. Primary Job Hires and Separations in Maine     In the jobs recovery from 2010 through 2015, the number of nonfarm jobs in ...

Job Growth in Nonprofit Entities in Maine is Strong – Here’s Why

Image
The 2008–2009 recession and aftermath caused employment to decline among private for profit businesses, the self-employed, and government before the jobs recovery took hold in 2011. The exception was private sector nonprofits, which added jobs throughout the downturn and recovery. Employment in private nonprofits increased 15,000 from 2005 to 2015; during the same period, total employment declined and then recovered to about the same level as a decade earlier. The 86,000 private nonprofit jobs in 2015 made up 13 percent of employment, up from 11 percent in 2005.   Job growth in private nonprofit entities has been more robust than any other employer class in the last decade       The preceding data and chart was drawn from the U.S. Census Bureau’s American Community Survey, which collects information on the number of people employed in nonprofits each year. Because of variability in estimates from year to year, we have used three-year averages. Estim...